| Credits | Overview | Plotting Styles | Commands | Terminals |
|---|
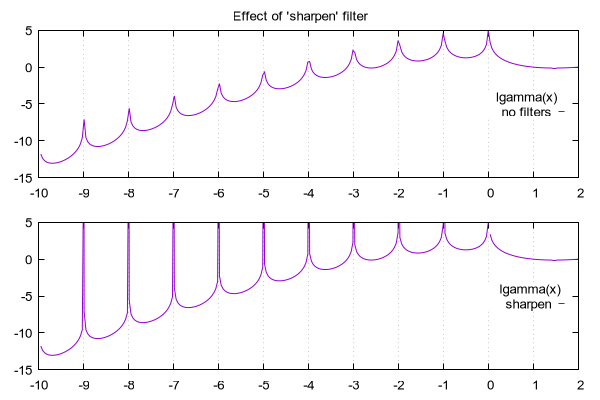
The sharpen filter applies only to function plots. It looks for extrema in the function being plotted, which may not lie exactly at any of the x values sampled to generate the component line segments making up the graph. The true local extrema are found by bisection and added to the set of sampled points. This reduces but does not entirely eliminate truncation of sharp peaks due to coarse sampling.
Example:
     set samples 150
     set xrange [-8:8]
     plot abs(sqrt(sin(x))) sharpen
Without the "sharpen" keyword, the resulting graph shows a continuous curve with minima at intervals of pi that should reach zero but are artefactually truncated to apparent minimal y values between 0.02 and 0.20. Adding the "sharpen" keyword produces instead a correct representation of the function with periodic sharp minima that reach y=0.