| Credits | Overview | Plotting Styles | Commands | Terminals |
|---|
The plotting style with mask is used to define a masking region that can be applied to pm3d surfaces or to images specified later in the same plot or splot command. Input data is interpreted as a stream of [x,y] or [x,y,z] coordinates defining the vertices of one or more polygons. As in plotting style with polygons, polygons are separated by a blank line. If the mask is part of a 3D (splot) command then a column of z values is required on input but is currently not used for anything.
If a mask definition is present in the plot command, then any subsequent image or pm3d surface in the same command can be masked by adding the keyword mask. If no mask has been defined, this keyword is ignored.
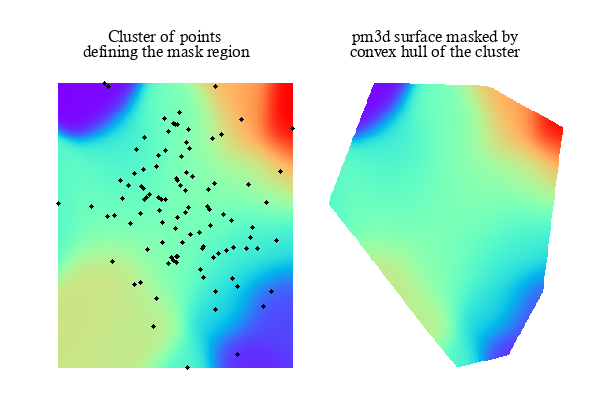
This example illustrates using the convex hull circumscribing a set of points to mask the corresponding region of a pm3d surface.

   set table $HULL
   plot $POINTS using 1:2 convexhull
   unset table
   set view map
   set multiplot layout 1,2
   splot $POINTS using 1:2:3 with pm3d, \
         $POINTS using 1:2:(0) nogrid with points
   splot $HULL using 1:2:(0) with mask, \
         $POINTS using 1:2:3 mask with pm3d
   unset multiplot
The splot command for the first panel renders the unmasked surface created by dgrid3d from the original points and then the points themselves, in that order. The splot command for the second panel renders the masked surface. Note that definition of the mask must come first (plot with mask), followed by the pm3d surface it applies to (plot style with pm3d modified by the mask keyword). A more complete version of this example is in the demo collection mask_pm3d.dem
Although it is not shown here, a single mask can include multiple polygonal regions.
The masking commands are EXPERIMENTAL. Details may change in a future release.