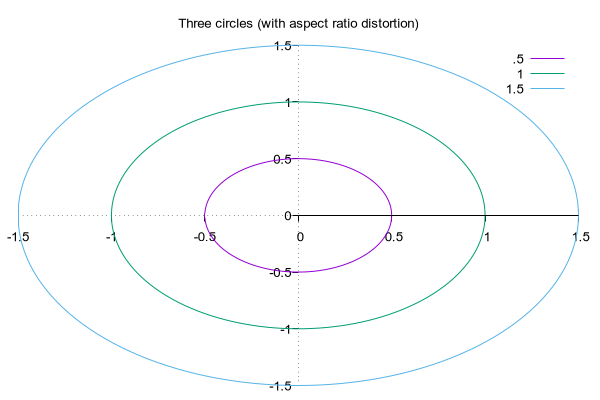
| # Various ways of plotting functions in polar coordinates # unset border set clip set polar set xtics axis nomirror set ytics axis nomirror unset rtics set samples 160 set zeroaxis set trange [0:2*pi] set title "Three circles (with aspect ratio distortion)" plot .5,1,1.5  | 
 
 | 
set title "" set key box plot cos(2*t)  | 
 
 | 
plot 2*sqrt(cos(t)),-2*sqrt(cos(t))  | 
 
 | 
plot sin(4*t),cos(4*t) set offset 0,0,0,0  | 
 
 | 
set xrange [-5:5] set yrange [-5:5] plot t/cos(3*t)  | 
 
 | 
set autoscale plot 1-sin(t)  | 
 
 | 
set trange [0:12*pi] plot 2*t  | 
 
 | 
butterfly(x)=exp(cos(x))-2*cos(4*x)+sin(x/12)**5 set samples 800 set title "Butterfly" unset key plot butterfly(t)  | 
 
 | 
set polar
set grid polar 
unset xtics
unset ytics
set border 0
set style fill solid 0.5
set rrange [0.1 : 4]
set size square
set key title "bounding radius 2.5"
set key outside top right samplen 0.7
plot 3.+sin(t)*cos(5*t) with filledcurve above r=2.5 notitle,\
     3.+sin(t)*cos(5*t) with line
 | 
 
 | 
# undo what we've done above  |