Back to demo index

gnuplot demo script: sampling.dem

autogenerated by webify.pl on Thu Nov 15 12:12:32 2018
gnuplot version gnuplot 5.2 patchlevel 5
# 18 Aug 2017
# Each of these plot commands failed on some version between 5.0 and 5.3.
# I collect them here to use as unit tests for continued success
# of the code added to repair breakage.
#
# Usage:  call 'sampling.dem' <testno>
#

set urange [1:100]
set vrange [1:100]
set xrange [1:100]
set key opaque box
set style data line

if (ARGC < 1) ARG1 = 0
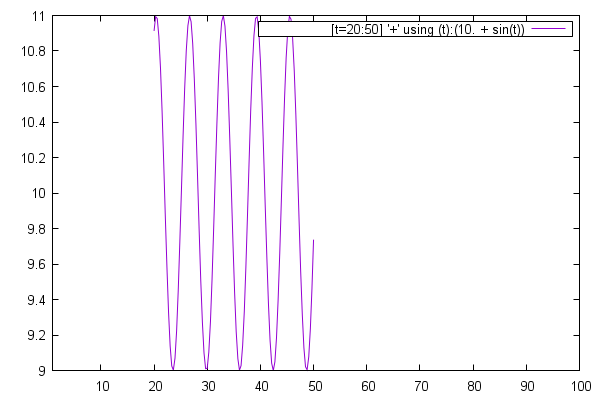
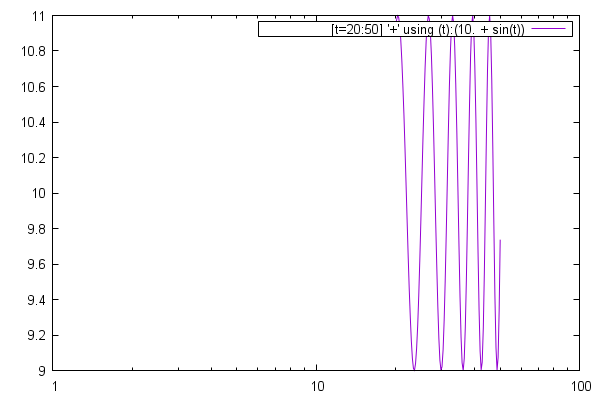
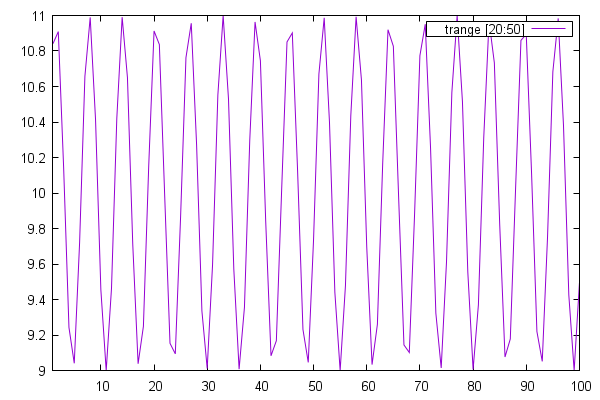
set trange [20:50]

if (ARG1 <= 1) {
    print "test 1: explicit trange distinct from xrange"
    plot '+' using 1:(10. + sin($1)) title "trange [20:50]"

Click here for minimal script to generate this plot


}

if (ARG1 <= 2) {
    print "test 2: range set by 'sample' keyword, linear x axis"
    plot sample [t=20:50] '+' using (t):(10. + sin(t))

Click here for minimal script to generate this plot


}


set log x

if (ARG1 <= 3) {
    print "test 3: range set by 'sample' keyword, logscale x axis"
    plot sample [t=20:50] '+' using (t):(10. + sin(t))

Click here for minimal script to generate this plot


}

unset log

if (ARG1 <= 4) {
    print "test 4: splot '++' with autoscaled y (linear xy)"
    splot '++' using 1:2:($1*$2)

Click here for minimal script to generate this plot


}

set log xy

if (ARG1 <= 5) {
    print "test 5: splot '++' with autoscaled y (logscale xy)"
    splot '++' using 1:2:($1*$2)

Click here for minimal script to generate this plot


}

unset log

if (ARG1 <= 6) {
    print "test 6: plot '++' with image (linear xy)"
    plot '++' using 1:2:($1*$2) with image

Click here for minimal script to generate this plot


}


set log xy

if (ARG1 <= 7) {
    print "test 7: plot '++' with image (logscale xy)"
    plot '++' using 1:2:($1*$2) with image

Click here for minimal script to generate this plot


}

#
#  piecewise functions along nonlinear x axis
#
unset border
set key center top reverse Left
set xzeroaxis
set yzeroaxis
set xtics axis out scale 1,8
set xtics add  (1.00000 1, 6.28319 1)
set ytics axis
set xrange [ .1 : 12 ] noreverse nowriteback


if (ARG1 <= 8) {
    print "test 8: multiple sampling ranges in one 2D plot command"
    set multiplot layout 2,1
    set title "Piecewise function sampling along linear x" font ",13"
    plot sample [*:1] x, [1:2.*pi] cos(x), [2.*pi:10] (x-8)**2
    set nonlinear x via x inv x
    set title "nonlinear (identity mapped) x" font ",13"
    plot sample [*:1] x, [1:2.*pi] cos(x), [2.*pi:10] (x-8)**2
    unset multiplot

Click here for minimal script to generate this plot


}


set xrange [1:100]
set yrange [1:100]
set urange [0:100]
set vrange [70:90]
set style data lines
set xyplane at 0

set hidden3d
set title "3D sampling range distinct from plot x/y range"
print "test 9: 3D sampling range distinct from plot x/y range"

splot '++' using 1:2:($1*25.*sin($2/10)), \
      [u=30:70][v=0:50] '++' using 1:2:(u*v), \
      [u=40:80][v=30:60] '++' using (u):(v):(u*sqrt(v)) lt 4, \
      [u=1:100][v=500:1000] '++' using (90):(u):(v) lt 6


Click here for minimal script to generate this plot


unset key
set view map
set xrange [ 20:100 ]
set yrange [ 0:80 ]
set size ratio 1.0
radius(x,y) = 10 * sqrt((x-50)**2 + (y-50)**2)
alpha(x,y) = radius(x,y) > 255 ? 0 : 255-radius(x,y)
set title "3D custom sampling on u and v using pseudofile '++'"
print "test 10: splot '++' with explicit sampling intervals"

splot sample [u=25:75:1][v=25:75:4] '++' \
      using 1:2:0:(u*4-50):(v*4-50):(255*sin(u*v/2500.)):(alpha(u,v)) with rgbalpha, \
      [u=25:75:4][v=25:75:1] '++' \
      using (u+20):(v-20):0:(u*4-50):(v*4-50):(255*sin(u*v/2500.)):(alpha(u,v)) with rgbalpha


Click here for minimal script to generate this plot


set title "2D custom sampling on u and v using pseudofile '++'"
print "test 10: plot '++' with explicit sampling intervals"

plot sample [u=25:75:1][v=25:75:4] '++' \
      using 1:2:(u*4-50):(v*4-50):(255*sin(u*v/2500.)):(alpha(u,v)) with rgbalpha, \
      [u=25:75:4][v=25:75:1] '++' \
      using (u+20):(v-20):(u*4-50):(v*4-50):(255*sin(u*v/2500.)):(alpha(u,v)) with rgbalpha


Click here for minimal script to generate this plot