# demo for plotting images using pixels and binary 2d data
#
# This demo can be used for terminals supporting image display.
# Currently supported are: X11, Aqua, postscript, png, pdf, svg,
# (e)pslatex, pstex.
# Prepared by Dan Sebald
# History:
# - 9.23. 2003 ds: redone in response to discussion list feedback
# - 5. 3. 2003 ds: 1st version
if ((GPVAL_VERSION == 4.1 || GPVAL_VERSION == 4.2) \
&& (!strstrt(GPVAL_COMPILE_OPTIONS,"+IMAGE"))) \
print ">>> Skipping demo <<<\n" ; \
print "This copy of gnuplot was built without support for plotting images" ; \
exit ;
print ""
print "The plotting styles \`image\` and \`rgbimage\` are intended for plotting"
print "images described in a data file either in the convential ASCII format or"
print "in a binary format described by the qualifiers \`binary\` and \`using\`."
print "All pixels have an (x,y) or (x,y,z) coordinate. These values can be"
print "included in the data file or implicitly determined with the sampling"
print "\'array\' key word and sampling periods \'dx\' and \'dy\'. The key words"
print "\'rotate\' and, for 3d plots, \'perpendicular\' control orientation."
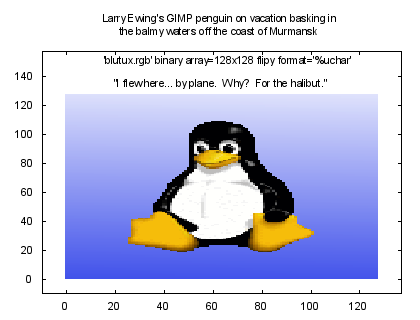
print "\nThe data for this image was stored as RGB triples, one byte per channel,"
print "without (x,y) coordinate information. This yields a most compact file."
print "The plotting command is displayed on the graph."
print ""
reset
set title "Larry Ewing's GIMP penguin on vacation basking in\nthe balmy waters off the coast of Murmansk"
set xrange [-10:137]
set yrange [-10:157]
set label "\"I flew here... by plane. Why? For the halibut.\"" at 64,135 center
plot 'blutux.rgb' binary array=128x128 flipy format='%uchar' with rgbimage
Click here for minimal script to generate this plot
reset
print ""
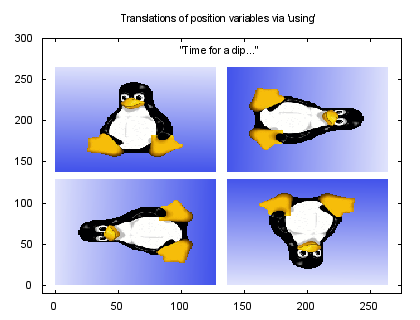
print "Images are typically stored in a file with the first datum being the"
print "top, left pixel. Without the ability to translate coordinates, the"
print "the result would be an upside down image."
print ""
print "The key word \'array\' means an implied sample array is applied"
print "to generate the locations of file data using the sampling periods"
print "dx, dy and dz. The x-dimension is always the contiguous points in"
print "a binary file. The y-dimension is the line number which is incremented"
print "upon the x-dimension reaching the line length. The z-dimension is"
print "the plane number which is incremented upon the y-dimension reaching"
print "the number of lines per plane."
print ""
print "To alter the location of the binary data when displayed via the \'plot\'"
print "command, use the key word \'rotate\' along with changing the sign of dx, dy"
print "and dz."
print ""
set title "Translations of position variables via 'using'"
set xrange [-10:275]
set yrange [-10:300]
unset key
set label "\"Time for a dip...\"" at 132,285 center
plot 'blutux.rgb' binary array=128x128 flipy center=( 64,201 ) format='%uchar' with rgbimage, \
'blutux.rgb' binary array=128x128 flipy rotation=-90d center=(201,201) format='%uchar' with rgbimage, \
'blutux.rgb' binary array=128x128 flip=y rotate=3.1415 center=(201,64) format='%uchar' with rgbimage, \
'blutux.rgb' binary array=128x128 flip=y rot=0.5pi center=(64,64) format='%uchar' using 1:2:3 with rgbimage
Click here for minimal script to generate this plot
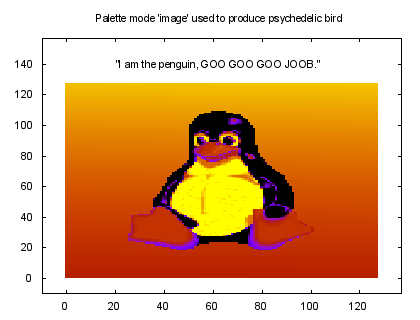
reset print "" print "There is the ability to plot both color images and palette based" print "images. This is controlled by the styles \`image\`, which derives" print "color information from the current palette, and \`rgbimage\`," print "which requires three components representing the red, blue and" print "green primary color scheme." print "" print "By the way, if you have a mouse active, click the right button" print "inside the image to isolate a portion of the image and see what" print "happens." print "" unset key set xrange [-10:137] set yrange [-10:157] set label 1 "\"I am the penguin, GOO GOO GOO JOOB.\"" at 63,140 center set title "Palette mode 'image' used to produce psychedelic bird" unset colorbox plot 'blutux.rgb' binary array=128x128 flipy format='%uchar%uchar%uchar' using ($1+$2+$3) with imageClick here for minimal script to generate this plot
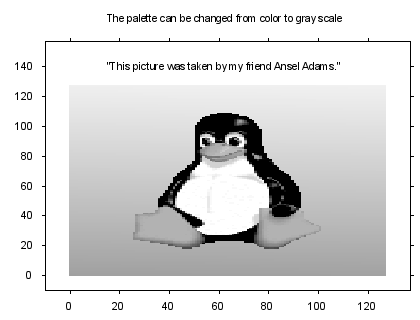
reset print "" print "Naturally, as with 3d color surfaces, the palette may be changed." print "This is an example of gray scale." print "" print "Also, notice in the plot command the key word \'flipy\'. This" print "means to change the direction of the sample along the y dimension" print "and is useful for the situation where images or other data are" print "stored in some direction other than that of the Cartesion system." print "Alone, \'flipD\' means do flipping in the D (x y or z) direction" print "for all records. Individual records can be controlled using the" print "syntax \'flipD=#,...,#\', where # is \'0\' or \'1\'." print "" unset key set xrange [-10:137] set yrange [-10:157] set tics out set label 1 "\"This picture was taken by my friend Ansel Adams.\"" at 63,140 center set title "The palette can be changed from color to gray scale" set palette gray unset colorbox plot 'blutux.rgb' binary array=128x128 flipy format='%uchar%uchar%uchar' using ($1+$2+$3)/3 with imageClick here for minimal script to generate this plot
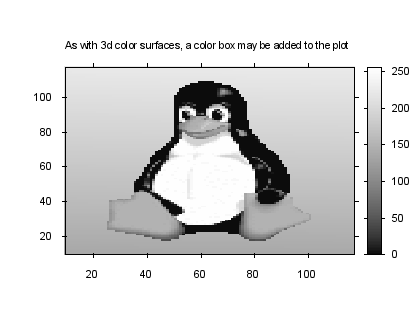
unset label 1 print "" print "Also, similar to 3d color surface plots, a color box showing the" print "palette mapping scheme can be added to the plot. The default" print "location is the right edge of the plot. The location can be set" print "manually using \`set colorbox\` and \`set margin\`." print "" print "As a prelude to the next graph, resize the plot window to judge" print "the refresh speed of the image drawing routine. Notice that when" print "the window is smaller, the image refresh is faster. There is more" print "decimation in the data of the original image and less data to plot." print "Furthermore, the window continues to refresh at a reasonable rate" print "even when the input image size becomes large (e.g., 1024 x 1024)" print "because the number of pixels on the screen remains about the same" print "while much of the hi resolution data is decimated." print "" unset key set pm3d map set xrange [10:117] set yrange [10:117] set tics out set colorbox set cbrange [0:255] set title "As with 3d color surfaces, a color box may be added to the plot" splot 'blutux.rgb' binary array=128x128 flipy format='%uchar%uchar%uchar' using ($1+$2+$3)/3 with imageClick here for minimal script to generate this plot
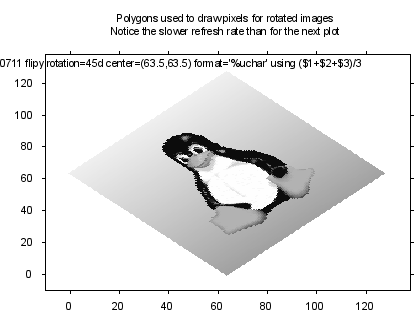
print "" print "The \'rotation\' key word works not only with angles of integer" print "multiples of 90 degrees but also arbitrary rotations. When" print "constructing an image, Gnuplot verifies that pixel locations" print "form a valid grid. Pixel widths are based upon the grid" print "spacing. If the image orientation is aligned with the view" print "axes, Gnuplot uses an efficient image driver routine. Otherwise," print "individual pixels are drawn using polygon shapes." print "" print "Resize this window and compare the plot's refresh rate to that of" print "the previous and next plot. Notice how in this example if the" print "window is small the image refresh does not speed up. Unlike the" print "image routine where image data is decimated, all color rectangles" print "must be redrawn no matter the size of the output image." print "" print "Also notice how the center of the image matches the tuple specified" print "with the key word \'center\' in the plot command. Before doing the" print "rotation, the image's natural center is subtracted, and after doing" print "the rotation, the specified center is added." print "" set key set xrange [-10:138] set yrange [-10:138] set tics out set title "Polygons used to draw pixels for rotated images\nNotice the slower refresh rate than for the next plot" unset colorbox plot 'blutux.rgb' binary array=128x128 dx=0.70711 dy=0.70711 flipy rotation=45d center=(63.5,63.5) format='%uchar' using ($1+$2+$3)/3 with imageClick here for minimal script to generate this plot
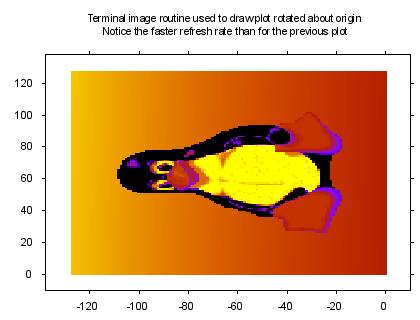
reset print "" print "The image of this plot is rotated 90 degrees and can utilize the" print "efficient image functions of terminal drivers. The plot refresh" print "is faster than the previous plot." print "" print "Furthermore, the image location in this case is specified via the" print "\'origin\' key word. As such, the rotation is done about the origin" print "as opposed to the center of the image. Notice the difference in" print "axis ranges." print "" unset key set xrange [-138:10] set yrange [-10:138] set tics out set title "Terminal image routine used to draw plot rotated about origin\nNotice the faster refresh rate than for the previous plot" unset colorbox plot 'blutux.rgb' binary array=128x128 dx=1 flip=y rotation=0.5pi origin=(0,0) format='%uchar' using ($1+$2+$3)/3 with imageClick here for minimal script to generate this plot
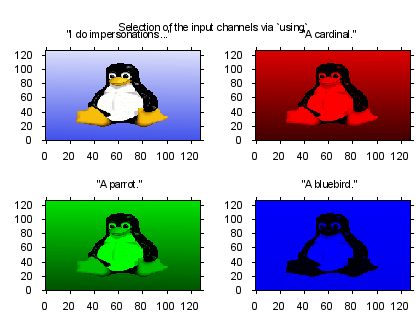
reset print "" print "Algebraic manipulation of the input variables can select various" print "components of the image. Here are three examples where two" print "channels--or analogous to the ASCII file, data \"columns\"--are ignored" print "This is done by using \`*\` in the format to indicate that a variable" print "of a certain size should be discarded. For example, to select the" print "green channel, \`%*uchar%uchar%*uchar\` is one alternative." print "" set size 1.0, 1.0 set origin 0.0, 0.0 set multiplot set size 0.5,0.48 set origin 0.0,0.47 unset key set xrange [-0.5:127.5] set yrange [-0.5:127.5] set tics out set label 1 "Selection of the input channels via \`using\`" at 140,160 center set title '"I do impersonations..."' offset 0,-0.5 plot 'blutux.rgb' binary array=128x128 flip=y format='%uchar' using 1:2:3 with rgbimage unset label 1 set size 0.5,0.48 set origin 0.5,0.47 set title '"A cardinal."' plot 'blutux.rgb' binary array=128x128 flip=y format='%uchar%*uchar%*uchar' using 1:(0):(0) with rgbimage set size 0.5,0.48 set origin 0.0,0.0 set title '"A parrot."' plot 'blutux.rgb' binary array=128x128 flipy format='%*uchar%uchar%*uchar' using (0):1:(0) with rgbimage set size 0.5,0.48 set origin 0.5,0.0 set title '"A bluebird."' plot 'blutux.rgb' binary array=128x128 flipy format='%*uchar%*uchar%uchar' using (0):(0):1 with rgbimage unset multiplotClick here for minimal script to generate this plot
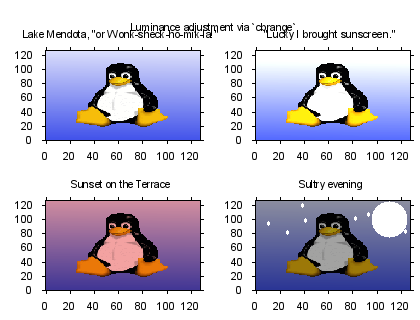
reset print "" print "The range of valid pixel values can be set via \`cbrange\`. If the" print "\`cbrange\` is in autoscale mode, Gnuplot will attempt to adjust the" print "luminance based upon the maximum pixel value in the image. Previous" print "graphs all had the \`cbrange\' in autoscale mode. However, there are" print "instances where one may want to force the image luminance or palette" print "to be of a certain range. For example, each channel of the penguin" print "image has an 8-bit depth, and hence the valid range is from 0 to 255." print "The logical choice of \`cbrange\' is [0:255]. This is done in the" print "upper left image. However, the image can be saturated by choosing a" print "smaller range, as done in the upper right image. Expanding the color" print "box range will darken the image, as shown in the bottom examples." print "" set size 1.0, 1.0 set origin 0.0, 0.0 set multiplot set size 0.5,0.48 set origin 0.0,0.47 unset key set xrange [-0.5:127.5] set yrange [-0.5:127.5] set tics out set label 1 "Luminance adjustment via \`cbrange\`" at 140,160 center set title 'Lake Mendota, "or Wonk-sheck-ho-mik-la!"' offset 0,-0.5 set cbrange [*:*] plot 'blutux.rgb' binary array=128x128 flipy format='%uchar' using 1:2:3 with rgbimage unset label 1 set size 0.5,0.48 set origin 0.5,0.47 set title '"Lucky I brought sunscreen."' set cbrange [0:200] plot 'blutux.rgb' binary array=128x128 flip=y format='%uchar' using 1:2:3 with rgbimage set size 0.5,0.48 set origin 0.0,0.0 set title 'Sunset on the Terrace' set cbrange [0:400] plot 'blutux.rgb' binary array=128x128 flip=y format='%uchar' using (1.5*$1):2:3 with rgbimage set size 0.5,0.48 set origin 0.5,0.0 set title 'Sultry evening' set cbrange [0:400] plot 'blutux.rgb' binary array=128x128 flipy format='%uchar' using 1:2:3 with rgbimage, '-' w points pt 7 ps 6 lt -2, '-' w points pt 7 ps 0.65 lt -2 110 100 e 10 95 38 120 82 102 26 82 93 108 41 99 123 84 e unset multiplotClick here for minimal script to generate this plot
reset
# Repeat of the 'using.dem' demo, but with binary 2d data. 'using.bin' is
# in the format int32, int8, int16/100, int8, int16/100, int16/100.
#
print ""
print "Not only can the 2d binary data mode be used for image data."
print "Here is an example that repeats the \`using.dem\` demo with the"
print "same data, but stored in binary format of differing sizes. It"
print "uses different format specifiers within the \'format\' string."
print "There are machine dependent and machine independent specifiers,"
print "display by the command \'show datafile binary datasizes\':"
print ""
show datafile binary datasizes
print ""
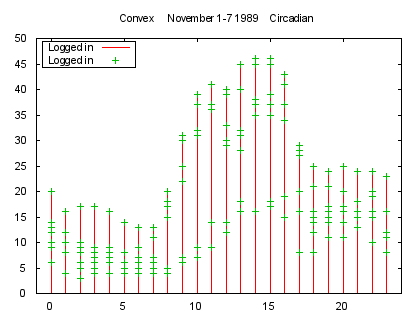
set title "Convex November 1-7 1989 Circadian"
set key left box
set xrange[-1:24]
plot 'using.bin' binary format='%*int32%int8%*int16%int8%*int16%*int16' using 1:2 title "Logged in" with impulses,\
'using.bin' binary format='%*int32%int8%*int16%int8%*int16%*int16' using 1:2 title "Logged in" with points
Click here for minimal script to generate this plot
reset
print ""
print "Again, a different format specification for \`using\` can be"
print "used to select different \"columns\" within the file."
print ""
set xrange [1:8]
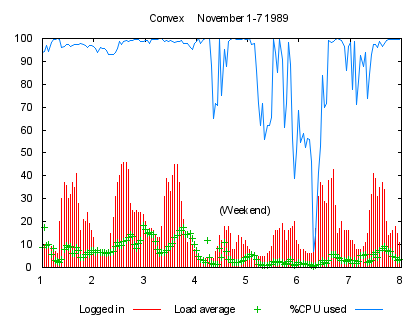
set title "Convex November 1-7 1989"
set key below
set label "(Weekend)" at 5,25 center
plot 'using.bin' binary format='%*int32%*int8%int16%int8%*int16%*int16' using ($1/100):2 title "Logged in" with impulses,\
'using.bin' binary format='%*int32%*int8%int16%*int8%int16%*int16' using ($1/100):($2/100) t "Load average" with points,\
'using.bin' binary format='%*int32%*int8%int16%*int8%*int16%int16' using ($1/100):($2/100) t "%CPU used" with lines
unset label
Click here for minimal script to generate this plot
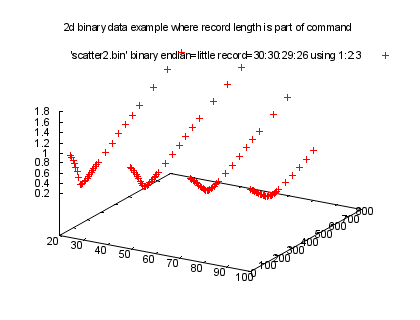
reset print "" print "Here is another example, one repeating the \`scatter.dem\`" print "demo. With binary data we cannot have blank lines to" print "indicate a break in data, as is done with ASCII files." print "Instead, we can specify the record lenths in the command." print "In this case, the data file contains the (x,y,z) coordinate" print "information, hence implicit derivation of that information" print "is not desired. Instead, the record lengths can be specified" print "using the keyword \'record\', which behaves the same as" print "\'array\' but does not generate coordinates. The command is" print "displayed on the graph." print "" set title "2d binary data example where record length is part of command" splot 'scatter2.bin' binary endian=little record=30:30:29:26 using 1:2:3Click here for minimal script to generate this plot
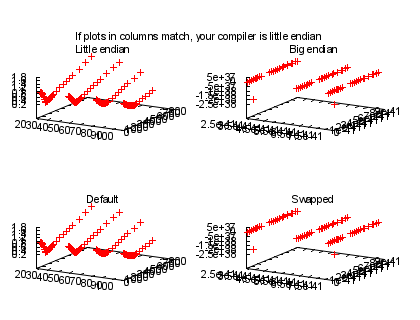
reset print "" print "For binary data, the byte endian format of the file and of the" print "compiler often require attention. Therefore, the key word" print "\'endian\' is provided for setting or interchanging byte" print "order. The allowable types are \'little\', \'big\', and" print "depending upon how your version of Gnuplot was compiled," print "\'middle\' (or \'pdp\') for those still living in the medieval" print "age of computers. These types refer to the file's endian." print "Gnuplot arranges bytes according to this endian and what it" print "determines to be the compiler's endian." print "" print "There are also the special types \'default\' and \'swap\' (or" print "\'swab\') for those who don't know the file type but realize" print "their data looks incorrect and want to change the byte read" print "order." print "" print "Here is an example showing the \`scatter.dem\` data plotted" print "with correct and incorrect byte order. The file is known" print "to be little endian, so the upper left plot is correct" print "appearance and the upper right plot is incorrect appearance." print "The lower two plots are default and swapped bytes. If the" print "plots within the columns match, your compiler uses little" print "endian. If diagonal plots match then your compiler uses" print "big endian. If neither of the bottom plots matches the" print "upper plots, Tux says you're living in the past." print "" set size 1.0, 1.0 set origin 0.0, 0.0 set multiplot set size 0.5,0.48 set origin 0.0,0.47 unset key set label 1 "If plots in columns match, your compiler is little endian" at 100,1200,3.0 center set title 'Little endian' offset 0,-0.5 splot 'scatter2.bin' binary record=30:30:29:26 endian=little using 1:2:3 unset label 1 set size 0.5,0.48 set origin 0.5,0.47 set title 'Big endian' splot 'scatter2.bin' binary record=30:30:29:26 endian=big using 1:2:3 set size 0.5,0.48 set origin 0.0,0.0 set title 'Default' splot 'scatter2.bin' binary record=30:30:29:26 endian=default using 1:2:3 set size 0.5,0.48 set origin 0.5,0.0 set title 'Swapped' splot 'scatter2.bin' binary record=30:30:29:26 endian=swap using 1:2:3 unset multiplotClick here for minimal script to generate this plot
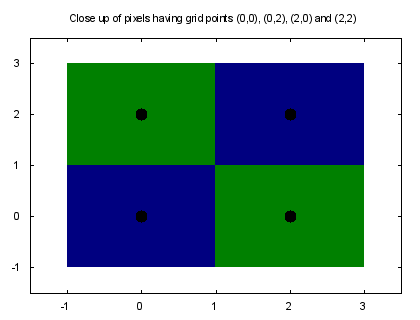
reset print "" print "This close up of a 2x2 image illustrates how pixels surround the" print "sampling grid points. This behavior is slightly different than" print "that for pm3d where the four grid points would be used to create" print "a single polygon element using an average, or similar mathematical" print "combination, of the four values at those points." print "" set title "Close up of pixels having grid points (0,0), (0,2), (2,0) and (2,2)" set xrange [-1.5:3.5] set yrange [-1.5:3.5] set cbrange [0:1] unset key plot '-' with rgbimage, '-' with points pt 7 ps 2 lt -1 0 0 0.0 0.0 0.5 0 2 0.0 0.5 0.0 2 0 0.0 0.5 0.0 2 2 0.0 0.0 0.5 e 0 0 0 2 2 0 2 2 eClick here for minimal script to generate this plot
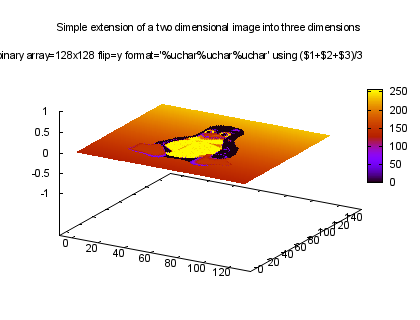
reset print "" print "Lower dimensional data may be extended to higher dimensional plots" print "via a number of simple, logical rules. The first step Gnuplot does" print "is sets the components for higher than the natural dimension of the" print "input data to zero. For example, a two dimensional image can be" print "displayed in the three dimensional plot as shown. Without" print "translation, the image lies in the x/y-plane." print "" set title "Simple extension of a two dimensional image into three dimensions" set xrange [-10:137] set yrange [-10:157] set cbrange [0:255] splot 'blutux.rgb' binary array=128x128 flip=y format='%uchar%uchar%uchar' using ($1+$2+$3)/3 with imageClick here for minimal script to generate this plot
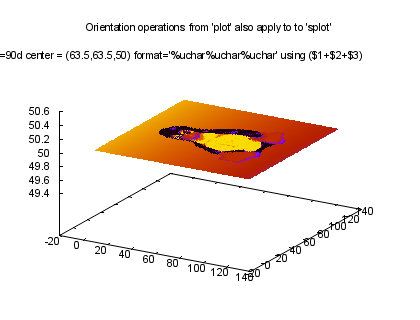
reset print "" print "The key words \'rotate\' and \'center\' still apply in \'splot\' with" print "rules similar to their use in \'plot\'. However, the center must be" print "specified as a three element tuple." print "" unset colorbox set title "Orientation operations from \'plot\' also apply to to \'splot\'" splot 'blutux.rgb' binary array=128x128 flipy rotate=90d center = (63.5,63.5,50) format='%uchar%uchar%uchar' using ($1+$2+$3) with imageClick here for minimal script to generate this plot
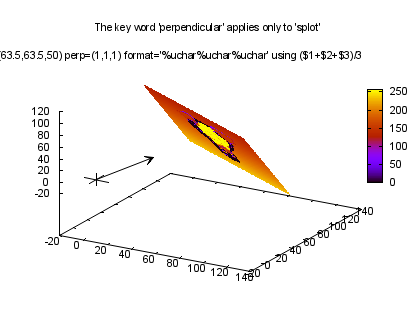
reset print "" print "To have full degrees of freedom in orienting the image, an additional" print "key word, \'perpendicular\', can translate the x/y-plane of the 2d" print "data so that it lies orthogonal to a vector given as a three element" print "tuple. The default vector is, of course, (0,0,1). The vector need" print "not be of unit length, as this example illustrates. Viewing this" print "plot with the mouse active can help visualize the image's orientation" print "by panning the axes." print "" set title "The key word \'perpendicular\' applies only to \'splot\'" set cbrange [0:255] set style line 1 lt -1 lw 1 set style line 2 lt -1 lw 1 set style arrow 1 nohead ls 1 set style arrow 2 head filled size screen 0.025,30,45 ls 2 set arrow from -10,0,0 to 10,0,0 as 1 set arrow from 0,-10,0 to 0,10,0 as 1 set arrow from 0,0,-10 to 0,0,10 as 1 set arrow from 0,0,0 to 30,30,30 as 2 splot 'blutux.rgb' binary array=128x128 flipy rot=1.0pi center = (63.5,63.5,50) perp=(1,1,1) format='%uchar%uchar%uchar' using ($1+$2+$3)/3 with imageClick here for minimal script to generate this plot
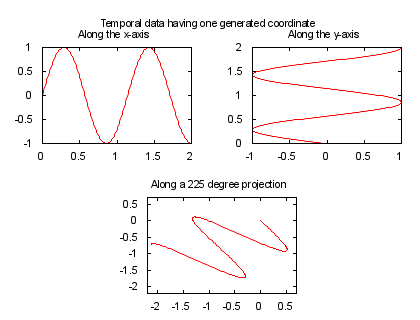
reset print "" print "These concepts of extending lower dimensional data also apply" print "to temporal-like signals. For example, a uniformly sampled" print "sinusoid, sin(1.75*pi*x), in a binary file having no data for" print "the independent variable can be displayed along any direction" print "for both \'plot\'..." print "" set size 1.0, 1.0 set origin 0.0, 0.0 set multiplot set size 0.5,0.48 set origin 0.0,0.47 unset key set xrange [0:2] set yrange [-1:1] set label 1 "Temporal data having one generated coordinate" at 2.25,1.5 center set title 'Along the x-axis' offset 0,-0.5 plot 'sine.bin' binary endian=little array=201 dx=0.01 origin=(0,0) format='%f' using 1 with lines unset label 1 set size 0.5,0.48 set origin 0.5,0.47 set xrange [-1:1] set yrange [0:2] set title 'Along the y-axis' plot 'sine.bin' binary endian=little array=201 dx=0.01 origin=(0,0) rotate=0.5pi format='%f' with lines set size 0.5,0.48 set origin 0.25,0.0 set xrange [-2.2:0.7] set yrange [-2.2:0.7] set title 'Along a 225 degree projection' plot 'sine.bin' binary endian=little array=201 dx=0.01 rotate=225d origin=(0,0) format='%f' using 1 with lines unset multiplotClick here for minimal script to generate this plot
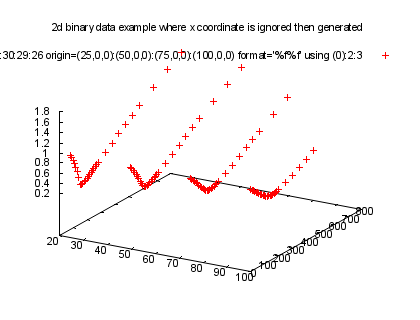
reset print "" print "...and \'splot\'. Here is the \'scatter.dem\' example again," print "but this simulates the case of the redundant x coordinates not" print "being in the binary file. The first \"column\" of the binary" print "file is ignored and reconstructed by orienting the various" print "data records." print "" set title "2d binary data example where x coordinate is ignored then generated" set xrange [20:100] set yrange [0:800] set zrange [0.2:1.8] splot 'scatter2.bin' binary endian=little record=30:30:29:26 origin=(25,0,0):(50,0,0):(75,0,0):(100,0,0) format='%f%f' using (0):2:3Click here for minimal script to generate this plot
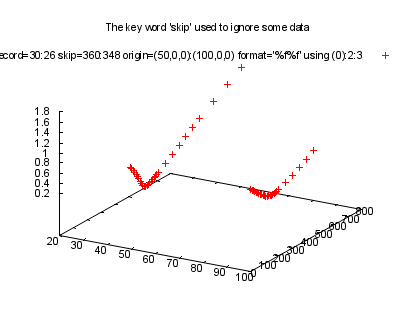
reset print "" print "Some binary data files have headers, which may be skipped via" print "the \'skip\' key word. Here is the \'scatter.dem\' example" print "again, but this time the first and third traces are skipped." print "The first trace is 30 samples of three floats so takes up 360" print "bytes of space. Similarly, the third trace takes up 348 bytes." print "" set title "The key word \'skip\' used to ignore some data" set xrange [20:100] set yrange [0:800] set zrange [0.2:1.8] splot 'scatter2.bin' binary endian=little record=30:26 skip=360:348 origin=(50,0,0):(100,0,0) format='%f%f' using (0):2:3Click here for minimal script to generate this plot
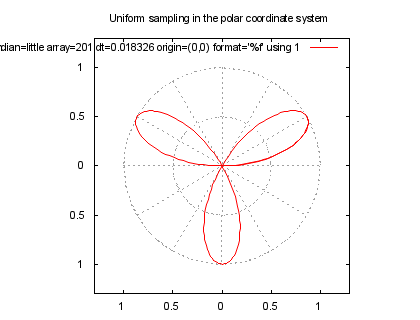
reset print "" print "Generating uniformly spaced coordinates is valid for polar" print "plots as well. This is useful for data acquired by machines" print "sampling in a circular fashion. Here the sinusoidal data" print "of the previous 2D plot put on a polar plot. Note the" print "pseudonyms \'dt\' meaning sample period along the angular," print "or theta, direction. In Gnuplot, cylindrical coordinate" print "notation is (t,r,z). [Different from common math convention" print "(r,t,z).]" print "" set size ratio 1 set title "Uniform sampling in the polar coordinate system" set polar set grid polar set xrange [-1.3:1.3] set yrange [-1.3:1.3] # The sinusoid has period T=8/7. Also, dx=0.01. So solving 8/7 dt = 2/3 pi dx, we get dt = 0.018326. plot 'sine.bin' binary endian=little array=201 dt=0.018326 origin=(0,0) format='%f' using 1 with linesClick here for minimal script to generate this plot
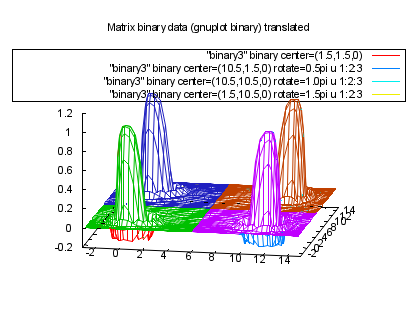
reset print "" print "Binary data stored in matrix format (i.e., gnuplot binary)" print "may also be translated with similar syntax. However, the" print "binary keywords \`format\`, \`array\` and \`record\` do not apply" print "because gnuplot binary has the requirements of float data" print "and grid information as part of the file. Here is an" print "example of a single matrix binary file input four times," print "each translated to a different location with different" print "orientation." print "" set style data lines set hidden3d set ticslevel 0 set key box set title "Matrix binary data (gnuplot binary) translated" set vi 70,10 set xrange [-3:15] set yrange [-3:15] set zrange [-0.2:1.2] splot "binary3" binary center=(1.5,1.5,0), \ "binary3" binary center=(10.5,1.5,0) rotate=0.5pi u 1:2:3, \ "binary3" binary center=(10.5,10.5,0) rotate=1.0pi u 1:2:3, \ "binary3" binary center=(1.5,10.5,0) rotate=1.5pi u 1:2:3Click here for minimal script to generate this plot
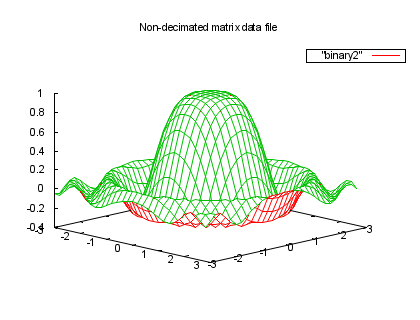
reset print "" print "As with ASCII data, decimation in various directions can" print "be achieved via the \`every\` keyword. (Note that no down-" print "sampling filter is applied such that you risk aliasing data" print "with the \`every\` keyword." print "" print "Here is a series of plots with increasing decimation." print "" set style data lines set hidden3d set ticslevel 0 set key box set title "Non-decimated matrix data file" set view 70,45 set xrange [-3:3] set yrange [-3:3] splot "binary2" binaryClick here for minimal script to generate this plot
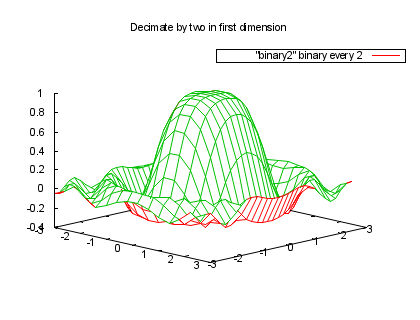
set title "Decimate by two in first dimension" splot "binary2" binary every 2Click here for minimal script to generate this plot
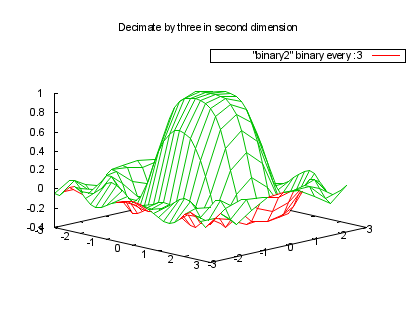
set title "Decimate by three in second dimension" splot "binary2" binary every :3Click here for minimal script to generate this plot
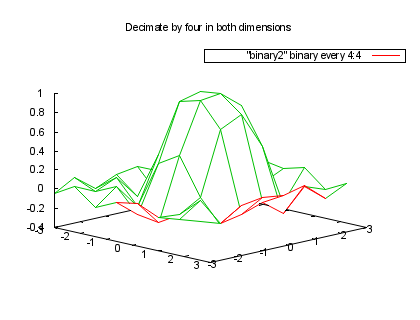
set title "Decimate by four in both dimensions" splot "binary2" binary every 4:4Click here for minimal script to generate this plot
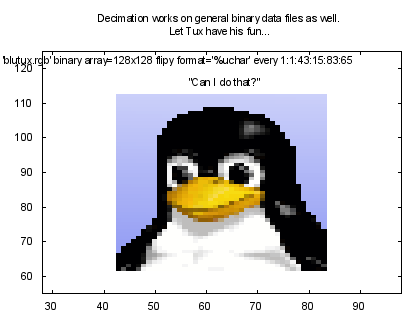
reset print "" print "Decimation works on general binary data files as well. Here is the" print "image file with increasing decimation." print "" set title "Decimation works on general binary data files as well.\nLet Tux have his fun..." set xrange [28:98] set yrange [55:125] set label 1 "\"Can I do that?\"" at 64,116 center plot 'blutux.rgb' binary array=128x128 flipy format='%uchar' every 1:1:43:15:83:65 with rgbimageClick here for minimal script to generate this plot
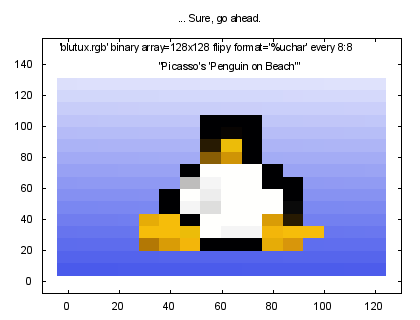
set title "... Sure, go ahead." set xrange [-10:130] set yrange [-8:157] set label 1 "\"Picasso's \'Penguin on Beach\'\"" at 64,139 center plot 'blutux.rgb' binary array=128x128 flipy format='%uchar' every 8:8 with rgbimageClick here for minimal script to generate this plot
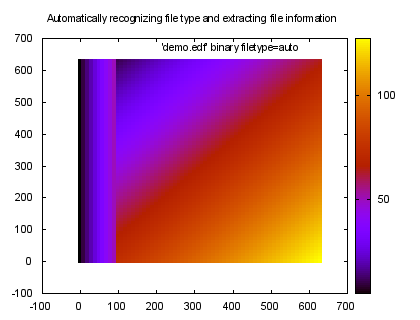
reset print "" print "Gnuplot understands a few common binary formats. Internally" print "a function is linked with various extensions. When the" print "extension is specified at the command line or recognized via" print "a special file type called \'auto\', Gnuplot will call the" print "function that sets up the necessary binary information. The" print "known extensions are displayed using the \'show filetype\'" print "command. E.g.," print "" show datafile binary filetypes print "Here's an example where an EDF file is recognized when Gnuplot" print "is in \'auto\' mode. Details are pulled from the header of" print "file itself and not specified at the command line. The command" print "line can still be used to over-ride in-file attributes." print "" set title "Automatically recognizing file type and extracting file information" plot 'demo.edf' binary filetype=auto with imageClick here for minimal script to generate this plot
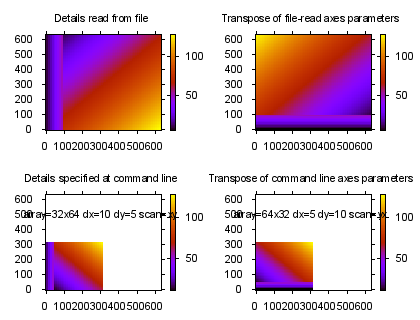
reset print "" print "The \'flip\', \'rotate\' and \'perpendicular\' qualifiers" print "should provide adequate freedom to orient data as desired." print "However, there is an additional key words \'scan\' which may" print "offer a more direct and intuitive manner of orienting data" print "depending upon the user's application and perspective." print "" print "\'scan\' is a 2 or 3 letter string representing how Gnuplot" print "should derive (x,y), (x,y,z), (t,r) or (t,r,z) from the" print "the datafile's scan order. The first letter pertains to the" print "fastest rate or point-by-point increment. The second letter" print "pertains to the medium rate or line-by-line increment. If" print "there is a third letter, it pertains to the slowest rate or" print "plane-by-plane increment. The default or inherent scan order" print "is \'scan=xyz\'." print "" print "The pseudonym \'transpose\' is equivalent to \'scan=yx\' when" print "generating 2D coordinates and \'scan=yxz\' when generating" print "3D coordinates." print "" print "There is a subtle difference between the behavior of \'scan\'" print "when dimension info is taken from the file itself as opposed" print "to entered at the command line. When information is gathered" print "from the file, internal scanning is unaltered so that issuing" print "the \'scan\' command may cause the number of samples along" print "the various dimensions to change. However, when the qualifier" print "\'array\' is entered at the command line, the array dimensions" print "adjust so that \'array=XxYxZ\' is always the number of samples" print "along the Cartesian x, y and z directions, respectively." print " set size 1.0, 1.0 set origin 0.0, 0.0 set multiplot set size 0.5,0.5 set origin 0.0,0.5 unset key set xrange [-5:635] set yrange [-5:635] set tics out set title 'Details read from file' offset 0,-0.5 plot 'demo.edf' binary filetype=auto with image set size 0.5,0.5 set origin 0.5,0.5 set title 'Transpose of file-read axes parameters' plot 'demo.edf' binary filetype=auto transpose with image set size 0.5,0.5 set origin 0.0,0.0 set title 'Details specified at command line' set label 1 "array=32x64 dx=10 dy=5 scan=xy" at 315,500 center plot 'demo.edf' binary array=32x64 dx=10 dy=5 scan=xy skip=1024 format="%*float%float" using 1 with image set size 0.5,0.5 set origin 0.5,0.0 set title 'Transpose of command line axes parameters' set label 1 "array=64x32 dx=5 dy=10 scan=yx" at 315,500 center plot 'demo.edf' binary array=64x32 dx=5 dy=10 scan=yx skip=1024 format="%*float%float" using 1 with image unset label 1 unset multiplotClick here for minimal script to generate this plot
reset
print ""
print "It is possible to enter binary data at the command line. Of"
print "course, the limitation to this approach is that keyboards will"
print "allow entering only a limited subset of the possible character"
print "values necessary to represent general binary data. For this"
print "reason, the primary application for binary data at the command"
print "line is using Gnuplot through a pipe. For example, if a pipe"
print "is established with a C program, the function \'fputs()\' can"
print "send ASCII strings containing the Gnuplot commands while the"
print "function \'fwrite()\' can send binary data."
print ""
print "Furthermore, there can be no special ending character such as"
print "in the case of ASCII data entry where \'e\' represents the end"
print "of data for the special file \'-\'. It is important to note"
print "that when \'binary\' is specified, Gnuplot will continue"
print "reading until reaching the number of elements specified via"
print "the \'array\' or \'record\' command."
print ""
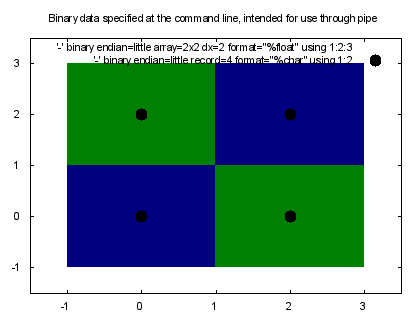
print "Here is an example of binary data at the command line where"
print "keyboard input has been side stepped by copying 48 bytes from"
print "a pre-existing binary file into this demo file."
print ""
set title "Binary data specified at the command line, intended for use through pipe"
set xrange [-1.5:3.5]
set yrange [-1.5:3.5]
set cbrange [0:1]
plot '-' binary endian=little array=2x2 dx=2 format="%float" using 1:2:3 with rgbimage,\
'-' binary endian=little record=4 format="%char" using 1:2 with points pt 7 ps 2 lt -1
�����������?�������?�����������?���������������?����
Click here for minimal script to generate this plot
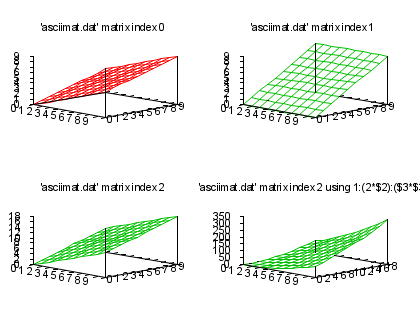
reset print "" print "ASCII data files have a matrix variant. Unlike matrix binary," print "ASCII binary may have multiple matrices per file, separted" print "by a blank line. The keyword \`index\` can select the desired" print "matrix to plot." print "" set style data lines set hidden3d set ticslevel 0 set key box set view 70,45 set multiplot set size 0.5,0.5 set origin 0.0,0.5 unset key set tics out set title "'asciimat.dat' matrix index 0" splot 'asciimat.dat' matrix index 0 set size 0.5,0.5 set origin 0.5,0.5 set title "'asciimat.dat' matrix index 1" splot 'asciimat.dat' matrix index 1 set size 0.5,0.5 set origin 0.0,0.0 set title "'asciimat.dat' matrix index 2" splot 'asciimat.dat' matrix index 2 set size 0.5,0.5 set origin 0.5,0.0 set title "'asciimat.dat' matrix index 2 using 1:(2*$2):($3*$3)" splot 'asciimat.dat' matrix index 2 using 1:(2*$2):($3*$3) unset multiplotClick here for minimal script to generate this plot
reset
print ""
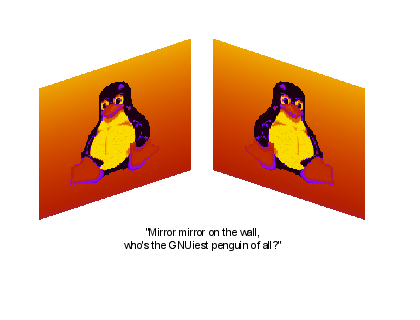
print "Tux says \"bye-bye\"."
print ""
set xrange [-0.5:137.5]
set yrange [-0.5:137.5]
unset border
unset xtics
unset ytics
unset ztics
unset key
unset colorbox
set tmargin 0
set bmargin 0
set rmargin 0
set lmargin 0
set view 60, 45, 1, 1
set label 1 "\"Mirror mirror on the wall,\nwho's the GNUiest penguin of all?\"" at 140,0,40 center
splot 'blutux.rgb' binary array=128x128 flip=y rot=90d origin=(0,0,0) perp = (1,0,0) format='%uchar' using ($1+$2+$3) with image, \
'blutux.rgb' binary array=128x128 flipy rot=90d origin=(+137,+137,0) perp=(0,1,0) format='%uchar' using ($1+$2+$3) with image
Click here for minimal script to generate this plot

reset

print ""
print "End of image demo..."