#
# Use watchpoints to place labels on contour lines, but only
# at positions constrained to lie along a line
#
#
if (!strstrt(GPVAL_COMPILE_OPTIONS, "+WATCHPOINTS")) {
print "This copy of gnuplot does not support watchpoints"
exit # return to caller
}
unset key
set xrange [-1 : 4]
set yrange [-3 : 3]
set zrange [-10 : 10]
f(x,y) = x**2 + y**2 * (1 - x)**3
set samples 51
set isosamples 51
set linetype 104 lc "dark-blue"
set cntrparam firstlinetype 101
set view map
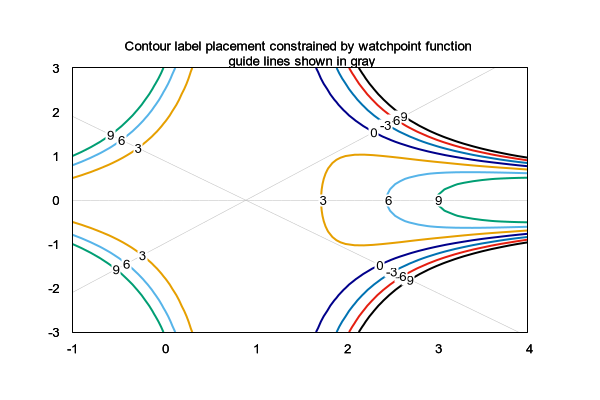
set title "Contour label placement constrained by watchpoint function \n guide lines shown in gray"
set tics scale 0.0
set style textbox opaque margins 0.5,0.5 fc bgnd noborder
set style watch labels nopoint center font ",10"
line1(x,y) = y - (1.1*x -1)
line2(x,y) = y + x - 0.9
set multiplot
unset contours
splot '+' using 1:(0):(0) with lines lw 0.5 lc "gray", \
'+' using 1:(1.1*$1 - 1):(0) with lines lw 0.5 lc "gray", \
'+' using 1:(-$1 + 0.9):(0) with lines lw 0.5 lc "gray"
set contours base
set cntrparam levels incr -9,3, 9
splot f(x,y) with lines nosurface lw 2 watch y=0 label sprintf("%2d", int(z)), \
f(x,y) with lines nosurface lt nodraw watch line1(x,y)=0 label sprintf("%2d ", int(z)), \
f(x,y) with lines nosurface lt nodraw watch line2(x,y)=0 label sprintf("%2d ", int(z))
unset multiplot
Click here for minimal script to generate this plot
