Back to demo index

gnuplot demo script: lines_arrows.dem

autogenerated by webify.pl on Sun Sep 17 19:54:44 2023
gnuplot version gnuplot 6.0 patchlevel rc2
#
# Combine dot/dash, linecolor, and arrowstyle demos into a single file.
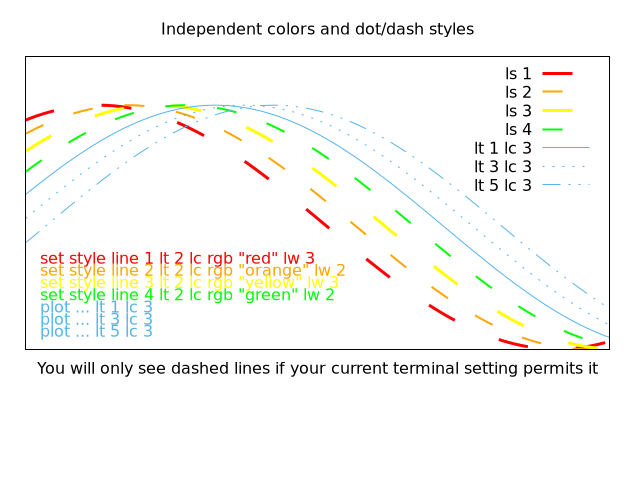
# Demonstrate explicit choice of both dot/dash pattern (linetype) 
# and color (linecolor).
#
set termoption dash

set xrange [-0.5:3.5]
set yrange [-1:1.4]
set bmargin 7
unset ytics
unset xtics
#
set title "Independent colors and dot/dash styles"
unset colorbox
#
# reset linetypes to base dash patterns
#
set for [i=1:5] linetype i dt i

#
# define line styles using explicit rgbcolor names
#
set style line 1 lt 2 lc rgb "red" lw 3
set style line 2 lt 2 lc rgb "orange" lw 2
set style line 3 lt 2 lc rgb "yellow" lw 3
set style line 4 lt 2 lc rgb "green" lw 2

#
set label 1 'set style line 1 lt 2 lc rgb "red" lw 3'    at -0.4, -0.25 tc rgb "red"
set label 2 'set style line 2 lt 2 lc rgb "orange" lw 2' at -0.4, -0.35 tc rgb "orange"
set label 3 'set style line 3 lt 2 lc rgb "yellow" lw 3' at -0.4, -0.45 tc rgb "yellow"
set label 4 'set style line 4 lt 2 lc rgb "green" lw 2'  at -0.4, -0.55 tc rgb "green"
set label 5 'plot ... lt 1 lc 3 ' at -0.4, -0.65 tc lt 3
set label 6 'plot ... lt 3 lc 3 ' at -0.4, -0.75 tc lt 3
set label 7 'plot ... lt 5 lc 3 ' at -0.4, -0.85 tc lt 3
#
set xlabel "You will only see dashed lines if your current terminal setting permits it"
#
show style line
#
# draw some plots
#
plot cos(x)     ls 1 title 'ls 1',   \
     cos(x-.2)  ls 2 title 'ls 2',\
     cos(x-.4)  ls 3 title 'ls 3',\
     cos(x-.6)  ls 4 title 'ls 4', \
     cos(x-.8)  lt 1 lc 3 title 'lt 1 lc 3',  \
     cos(x-1.)  lt 3 lc 3 title 'lt 3 lc 3',  \
     cos(x-1.2) lt 5 lc 3 title 'lt 5 lc 3'

#

Click here for minimal script to generate this plot


unset for [i=1:8] label i
set title "The pointinterval property is another way to create interrupted lines"
set xlabel "This technique works best for equally spaced data points"
set bmargin 6
set offset .05, .05
set xrange [-0.5:3.3]
set style func linespoints

plot cos(x)     lt -1 pi -4 pt 6 title 'pi -4',   \
     cos(x-.8)  lt -1 pi -3 pt 7 ps 0.2 title 'pi -3 pt 7 ps 0.2',  \
     cos(x-.2)  lt -1 pi -6 pt 7 title 'pi -6',\
     cos(x-.4)  lt -1 pi -3 pt 4 title 'pi -3',\
     cos(x-.6)  lt -1 pi -5 pt 5 title 'pi -5', \
     cos(x-1.)  with line lt -1 notitle,  \
     cos(x+.2)  with line lt -1 lw 2 title 'lw 2'

#

Click here for minimal script to generate this plot


set title "The pointinterval property also works with character point symbols"
set style data linespoints
set pointintervalbox 1.5
unset xlabel
myencoding = GPVAL_ENCODING
set encoding utf8

plot '+' using 1:(cos(x-1.))  with line lt -1 lw 1 title 'lw 1',  \
     '+' using 1:(cos(x))     lt -1 pi -4 pt "C" title 'pi -4',   \
     '+' using 1:(cos(x-.8))  lt -1 pi -3 pt "D" title 'pi -3 pt "D"',  \
     '+' using 1:(cos(x-.2))  lt -1 pi -6 pt "✠" tc rgb "blue" title 'pi -6 tc rgb "blue"',\
     '+' using 1:(cos(x-.4))  lt -1 pi -3 pt "✲" title 'pi -3',\
     '+' using 1:(cos(x-.6))  lt nodraw pi 5 pt "☺" title 'lt nodraw pi 5', \
     '+' using 1:(cos(x+.2))  with line lt -1 lw 2 title 'lw 2'

#

Click here for minimal script to generate this plot


set title "The pointnumber property is similar, but limits the total number of points"
set style data linespoints
set pointintervalbox 1.5
unset xlabel
myencoding = GPVAL_ENCODING
set encoding utf8

plot '+' using 1:(cos(x-1.))  with line lt -1 lc "blue" lw 2 title 'lines only',  \
     '+' using 1:(cos(x-.8))  lt -1 pt 6 title 'linespoints default',\
     '+' using 1:(cos(x-.6))  lt -1 pn -32 pt "✲" title 'pn 32',\
     '+' using 1:(cos(x-.4))  lt -1 pn -8 pt "D" title 'pn 8',  \
     '+' using 1:(cos(x-.2))  lt -1 pn -4 pt "C" title 'pn 4'


Click here for minimal script to generate this plot


set encoding myencoding

set xrange [-1000:1000]
set yrange [-178:86]
set tics scale 0

set style line 1 lt 1 lw 2
set style line 2 lt 1 lc rgb "skyblue" lw 2

set style arrow 1 head filled size screen 0.025,30,45 ls 1
set style arrow 2 head nofilled size screen 0.03,15 ls 2
set style arrow 3 head filled size screen 0.03,15,45 ls 1
set style arrow 4 head filled size screen 0.03,15 ls 2
set style arrow 5 heads filled size screen 0.03,15,135 ls 1
set style arrow 6 head empty size screen 0.03,15,135 ls 2
set style arrow 7 nohead ls 1
set style arrow 8 heads size screen 0.008,90 ls 2

print ' We have defined the following arrowstyles:'
show style arrow

set arrow from -500,-100 rto 1000, 0  as 1
set arrow from -500,-110 rto 1000, 0  as 2
set arrow from -500,-120 rto 1000, 0  as 3
set arrow from -500,-130 rto 1000, 0  as 4
set arrow from -500,-140 rto 1000, 0  as 5
set arrow from -500,-150 rto 1000, 0  as 6
set arrow from -500,-160 rto 1000, 0  as 7
set arrow from -500,-170 rto 1000, 0  as 8

set label 'arrowstyle 1:' at -520,-100 right
set label 'arrowstyle 2:' at -520,-110 right
set label 'arrowstyle 3:' at -520,-120 right
set label 'arrowstyle 4:' at -520,-130 right
set label 'arrowstyle 5:' at -520,-140 right
set label 'arrowstyle 6:' at -520,-150 right
set label 'arrowstyle 7:' at -520,-160 right
set label 'arrowstyle 8:' at -520,-170 right

set title 'Top: plot with vectors arrowstyle 1, Bottom: explicit arrows'
plot 'arrowstyle.dat' using 1:2:(0):3 notitle with vectors arrowstyle 3

Click here for minimal script to generate this plot