Back to demo index

gnuplot demo script: layout.dem

autogenerated by webify.pl on Sun Sep 17 19:54:44 2023
gnuplot version gnuplot 6.0 patchlevel rc2
#
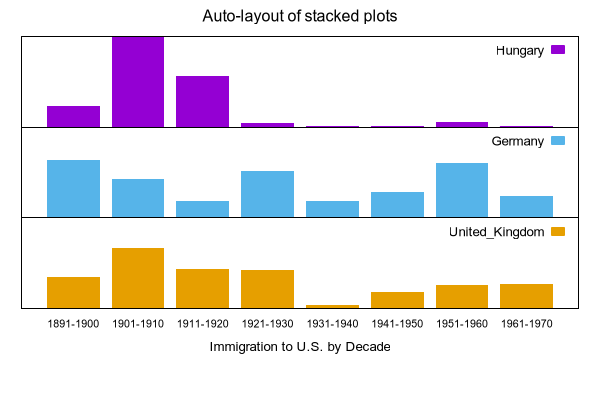
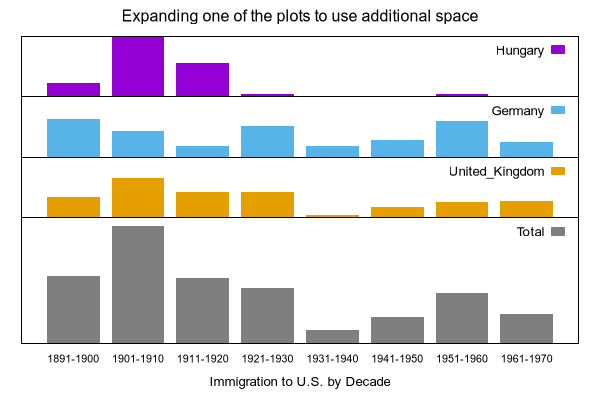
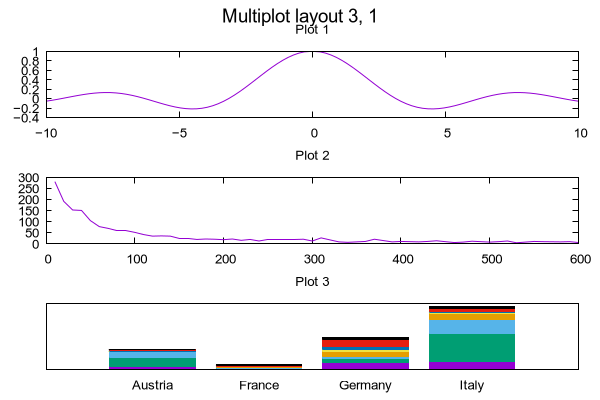
# Gnuplot version 5.0 demo of multiplot auto-layout capability
#
#
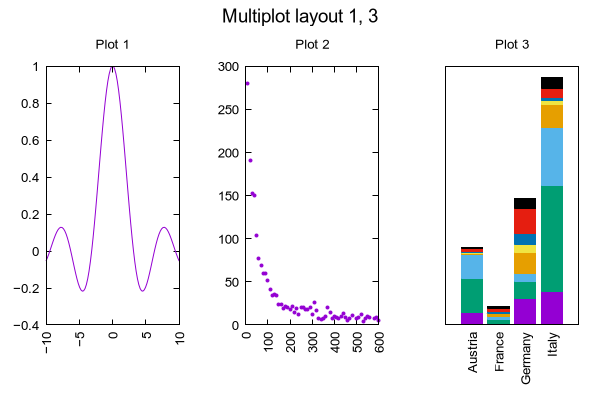
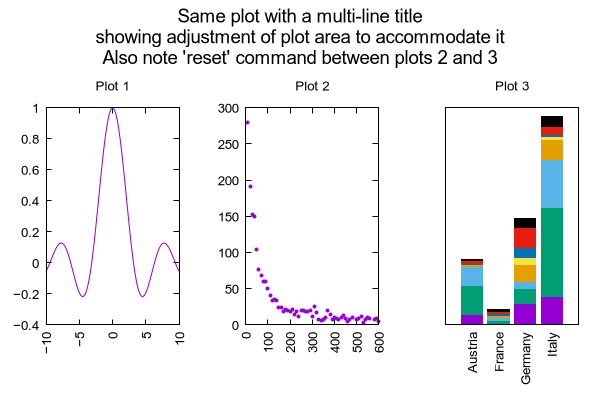
set multiplot layout 3, 1 title "Multiplot layout 3, 1" font ",14"
set tmargin 2
set title "Plot 1"
unset key
plot sin(x)/x
#
set title "Plot 2"
unset key
plot 'silver.dat' using 1:2 ti 'silver.dat'
#
set style histogram columns
set style fill solid
set key autotitle column
set boxwidth 0.8
set format y "    "
set tics scale 0
set title "Plot 3"
plot 'immigration.dat' using 2 with histograms, \
     '' using 7  with histograms , \
     '' using 8  with histograms , \
     '' using 11 with histograms 
#
unset multiplot
#
#
#

Click here for minimal script to generate this plot


set multiplot layout 1,3 title "Multiplot layout 1, 3" font ",14"
set xtics rotate
set bmargin 5
#
set title "Plot 1"
unset key
plot sin(x)/x
#
set title "Plot 2"
unset key
plot 'silver.dat' using 1:2 ti 'silver.dat'
#
set title "Plot 3"
set style histogram columns
set style fill solid
set key autotitle column
set boxwidth 0.8
set format y "    "
set tics scale 0
plot 'immigration.dat' using 2 with histograms , \
     '' using  7 with histograms , \
     '' using  8 with histograms , \
     '' using 11 with histograms 
#
unset multiplot
#
#
#
#

Click here for minimal script to generate this plot


set multiplot layout 1,3 title "Same plot with a multi-line title\nshowing adjustment of plot area to accommodate it\nAlso note 'reset' command between plots 2 and 3" font ",14"
set xtics rotate
set bmargin 5
#
set title "Plot 1"
unset key
plot sin(x)/x
#
set title "Plot 2"
unset key
plot 'silver.dat' using 1:2 ti 'silver.dat'
#
set title "Plot 3"
set style histogram columns
set style fill solid
set key autotitle column
set boxwidth 0.8
set format y "    "
set bmargin 5
set tics scale 0
set xtics rotate
plot 'immigration.dat' using 2 with histograms , \
     '' using  7 with histograms , \
     '' using  8 with histograms , \
     '' using 11 with histograms 
#
unset multiplot

Click here for minimal script to generate this plot


#
#          Stacked Plot Demo
#
# Set top and bottom margins to 0 so that there is no space between plots.
# Fix left and right margins to make sure that the alignment is perfect.
# Turn off xtics for all plots except the bottom one.
# In order to leave room for axis and tic labels underneath, we ask for
# a 4-plot layout but only use the top 3 slots.
#
set tmargin 0
set bmargin 0
set lmargin 3
set rmargin 3
unset xtics
unset ytics

set multiplot layout 4,1 title "Auto-layout of stacked plots\n" font ",12"

set key autotitle column nobox samplen 1 noenhanced
unset title
set style data boxes
set yrange [0 : 800000]

plot 'immigration.dat' using 3 lt 1
plot 'immigration.dat' using 8 lt 3
set xtics nomirror
set tics scale 0 font ",8"
set xlabel "Immigration to U.S. by Decade"
plot 'immigration.dat' using 21:xtic(1) lt 4

unset multiplot

Click here for minimal script to generate this plot


#
#          Stacked Plot Demo Continued
#
# Another option is to expand the (N-1)th plot to fill 
# additional space
#
unset xlabel
unset xtics
unset ytics

set multiplot layout 6,1 title "Expanding one of the plots to use additional space\n" font ",12"

set key autotitle column nobox samplen 1 noenhanced
unset title
set style data boxes
set yrange [0 : 800000]

plot 'immigration.dat' using 3 lt 1
plot 'immigration.dat' using 8 lt 3
plot 'immigration.dat' using 21 lt 4
set xtics nomirror
set tics scale 0 font ",8"
set xlabel "Immigration to U.S. by Decade"

# Override automatic calculation of lower plot boundary
set bmargin at screen 0.14
set yrange [0:*]
plot 'immigration.dat' using ($3+$8+$21):xtic(1) lt 9 title "Total"

unset multiplot

Click here for minimal script to generate this plot


#
# Set overall margins for the combined set of plots and size them
# to generate a requested inter-plot spacing
#
if (!exists("MP_LEFT"))   MP_LEFT = .1
if (!exists("MP_RIGHT"))  MP_RIGHT = .95
if (!exists("MP_BOTTOM")) MP_BOTTOM = .14
if (!exists("MP_TOP"))    MP_TOP = .9
if (!exists("MP_xGAP"))   MP_xGAP = 0.05
if (!exists("MP_yGAP"))   MP_yGAP = 0.02

set multiplot layout 2,2 columnsfirst title "{/:Bold=15 Multiplot with explicit page margins}" \
              margins screen MP_LEFT, MP_RIGHT, MP_BOTTOM, MP_TOP spacing screen MP_xGAP, MP_yGAP

set format y "%.1f"
set key box opaque
set ylabel 'ylabel'
set xrange [-2*pi:2*pi]

plot sin(x) lt 1
set xlabel 'xlabel'
plot cos(x) lt 2

unset ylabel
unset ytics

unset xlabel
plot sin(2*x) lt 3
set xlabel 'xlabel'
plot cos(2*x) lt 4
unset multiplot


Click here for minimal script to generate this plot