#
# demo for the use of "set object circle" and "plot ... with circles"
#
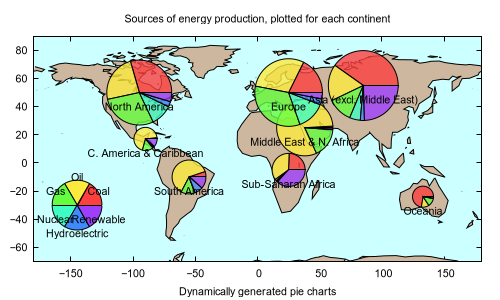
# Dynamically calculated pie charts
# Reworked earlier demo to use data from a file with a more realistic format,
# a table with regions in the rows and energy numbers in the columns.
# Radius and wedges for each pie chart are generated directly from the data.
# Tilman <theozh@gmx.net>
# November 2017
#
set obj 1 rect from graph 0,0 to graph 1,1 behind fc rgb "cyan" fs solid 0.2
set angle degree
set datafile separator whitespace
set xrange [-180:180]
set yrange [-70:90]
set palette model HSV func gray*0.75, 0.75, 0.99
set style fill solid 1.0 border lt -1
set style textbox opaque fc "white" margin 0,0
unset colorbox
set xlabel "Dynamically generated pie charts"
set title "Sources of energy production, plotted for each continent"
keyx = -145.
keyy = -30.
keyr = 20.
Scale = 3000.
EnergyTypes = 6
Regions = 8
array EnergySum[Regions]
do for [i=1:Regions] { EnergySum[i] = 0 }
plot 'world.dat' using 1:2 with filledcurves lc rgb "bisque" notit, \
for [i=1:EnergyTypes] for [j=1:Regions] 'WorldEnergy.dat' using 2:1:\
(Total = (sum [col=4:9] column(col)), sqrt(Total/Scale)):(EnergySum[j]*360./Total):\
(EnergySum[j]=EnergySum[j]+column(i+3), EnergySum[j]*360./Total):(i-1) \
every ::j:0:j:0 with circles lc pal fs transparent solid 0.8 border lc "black" not,\
'' using 2:($1-10):3:0 with labels not,\
for [i=1:EnergyTypes] '' using (keyx):(keyy):(keyr):\
((i-1)*360./EnergyTypes):(i*360./EnergyTypes):(i-1) \
every ::0:0:0:0 with circles lc pal fs solid 1.0 border lc "black" not,\
for [i=1:EnergyTypes] '' using (keyx+keyr*cos((i-0.5)*360./EnergyTypes)):\
(keyy+keyr*sin((i-0.5)*360./EnergyTypes)):(stringcolumn(i+3)) \
every ::0:0:0:0 with labels center not
Click here for minimal script to generate this plot