#
# The "with histograms" plot style automates the construction of barcharts
# with various stacking and clustering options. But sometimes it doesn't
# handle exactly what you want, particularly for color assignment.
#
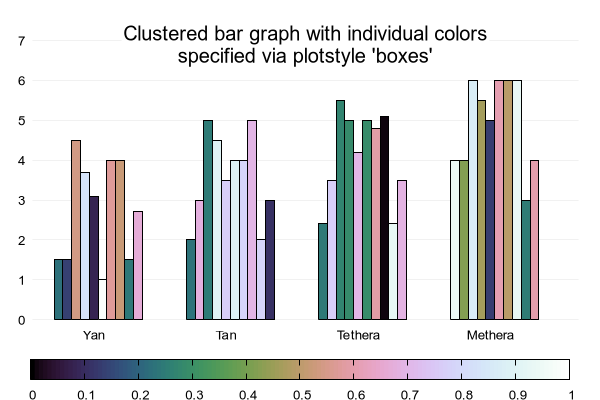
# This demo show using the "with boxes" plot style to generate clustered
# histograms with individual box coloring generated by a user function.
# It could, for example, depend on data from other columns in the input.
#
set title "Clustered bar graph with individual colors\nspecified via plotstyle 'boxes'"
set title boxed offset 0,-3 font ",15"
set style fill solid border lt -1
set style textbox opaque noborder
set boxwidth 1.0 abs
ClusterSize = 15
unset key
set yrange [0:7]
set xrange [-2:60]
set border 0
category = "Yan Tan Tethera Methera Pimp"
set xtics scale 0 ()
set ytics scale 0 nomirror
set grid y
set colorb horizontal user origin .05, .05 size .9, .05
set palette cubehelix
set bmargin at screen 0.2
set tmargin at screen 0.9
set for [i=1:4] xtics add (word(category,i) 5+(i-1)*ClusterSize)
xcoord(i) = i*ClusterSize + column(1)
color(i) = rand(0)
plot for [i=0:3] 'candlesticks.dat' \
using (xcoord(i)):(column(i+2)):(color(i)) with boxes lc palette z
Click here for minimal script to generate this plot
